Data from detectors P3, P5, P7 and A2 for 1990. See the IMP-8 EECA description for rate-flux conversion.
| Start Date | End Date | Links | |
|---|---|---|---|
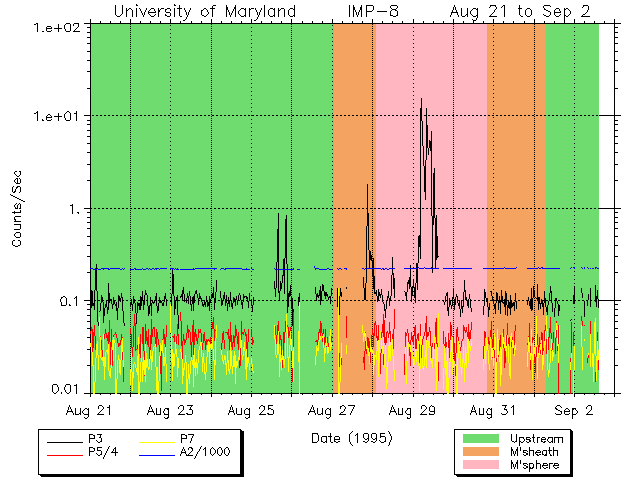
| 1995 AUG 20 | 1995 SEP 02 | Plot | List |
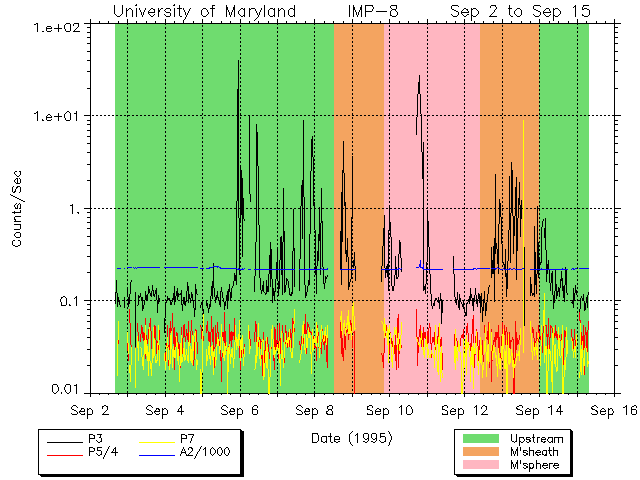
| 1995 SEP 02 | 1995 SEP 15 | Plot | List |
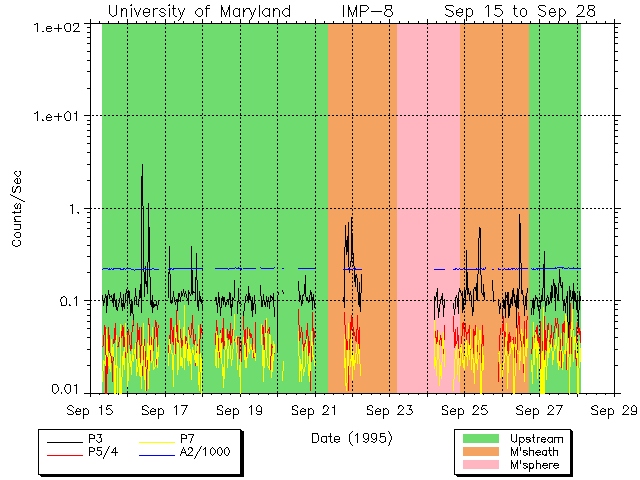
| 1995 SEP 15 | 1995 SEP 28 | Plot | List |
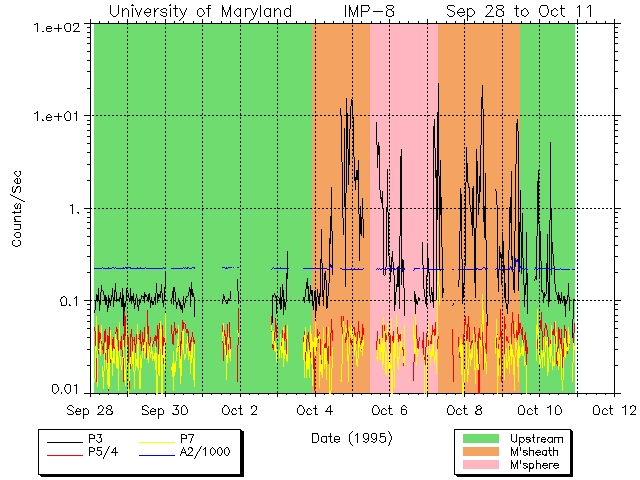
| 1995 SEP 28 | 1995 OCT 11 | Plot | List |
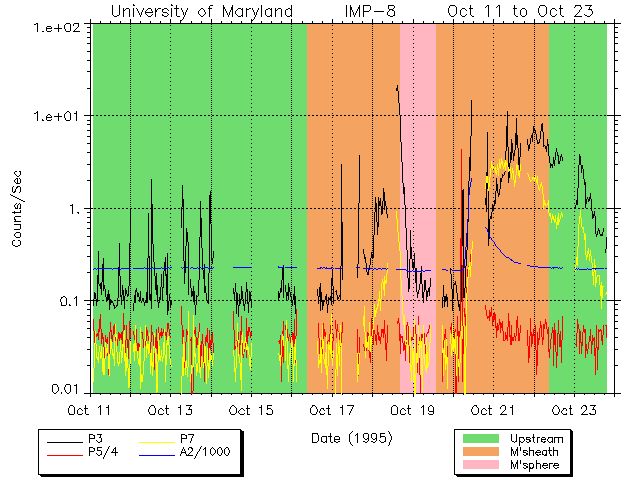
| 1995 OCT 11 | 1995 OCT 23 | Plot | List |
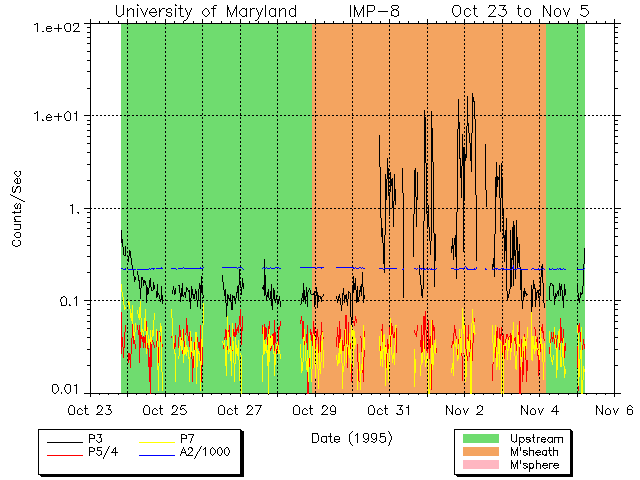
| 1995 OCT 23 | 1995 NOV 05 | Plot | List |
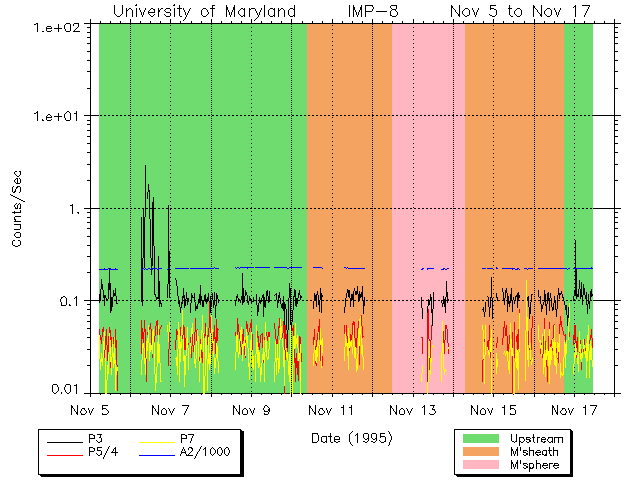
| 1995 NOV 05 | 1995 NOV 17 | Plot | List |
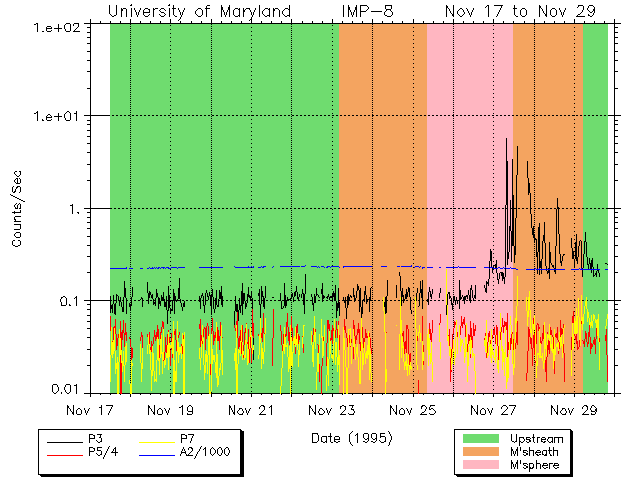
| 1995 NOV 17 | 1995 NOV 29 | Plot | List |
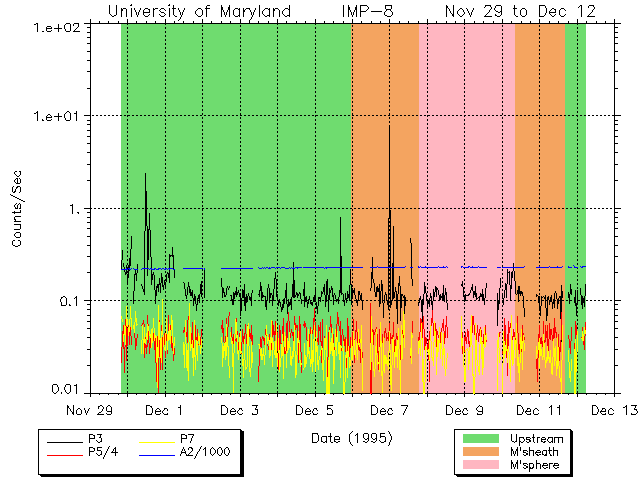
| 1995 NOV 29 | 1995 DEC 12 | Plot | List |
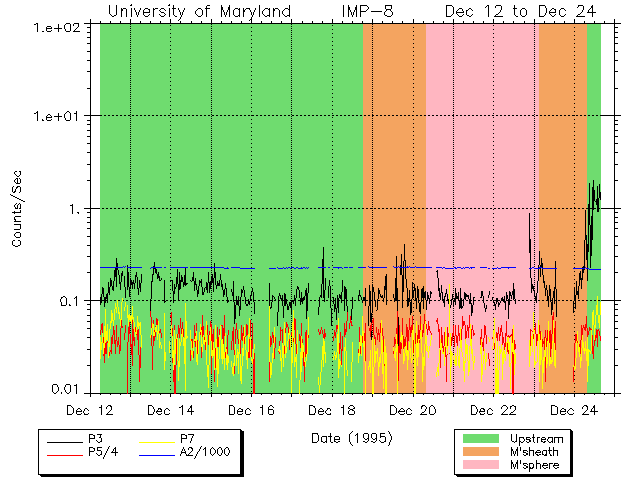
| 1995 DEC 12 | 1995 DEC 24 | Plot | List |
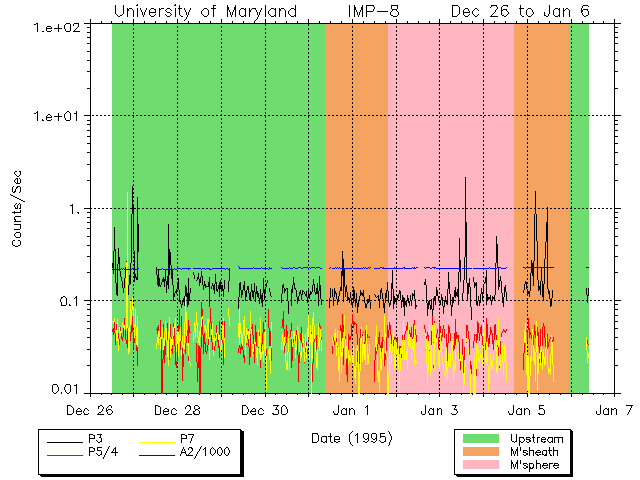
| 1995 DEC 26 | 1996 JAN 06 | Plot | List |
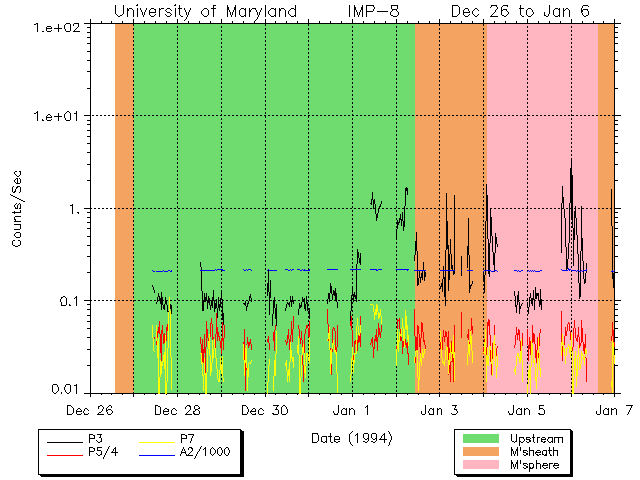
| 1994 December 26 | 1995 January 7 | Plot | List |
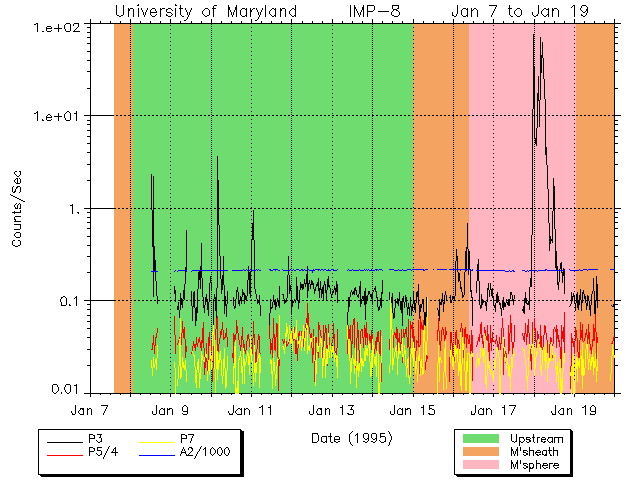
| 1995 January 7 | 1995 January 20 | Plot | List |
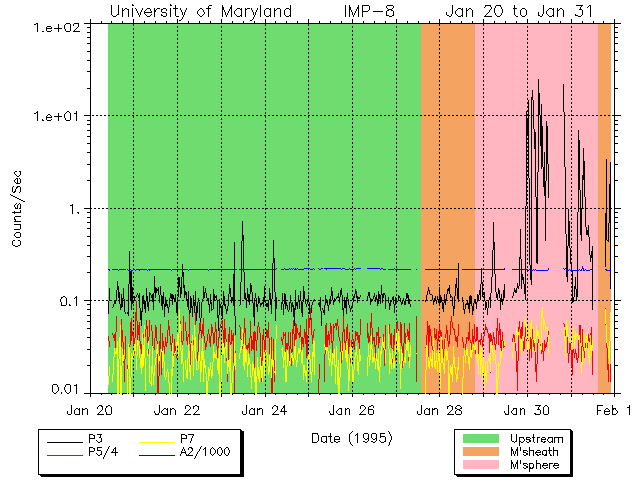
| 1995 January 20 | 1995 February 1 | Plot | List |
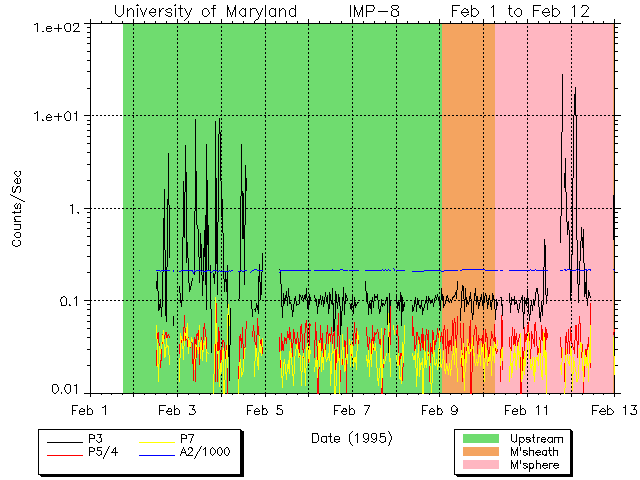
| 1995 February 1 | 1995 February 13 | Plot | List |
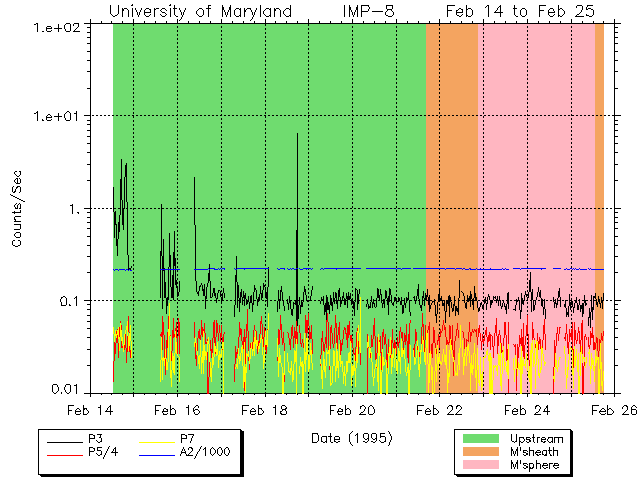
| 1995 February 14 | 1995 February 26 | Plot | List |
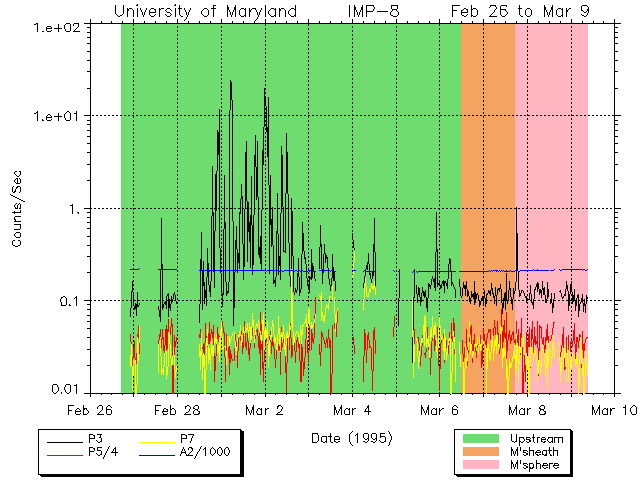
| 1995 February 26 | 1995 March 10 | Plot | List |
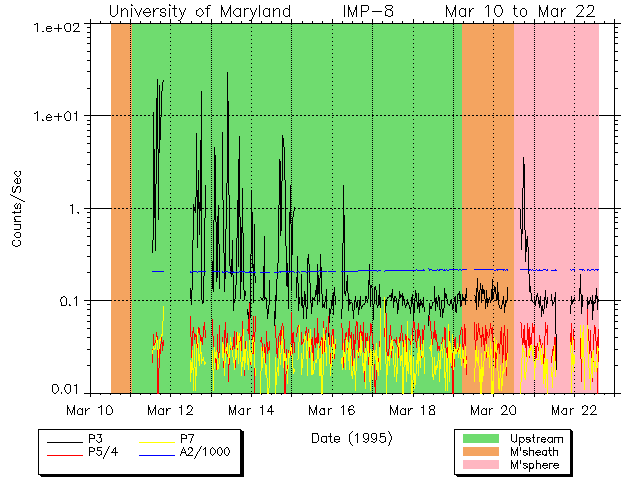
| 1995 March 10 | 1995 March 23 | Plot | List |
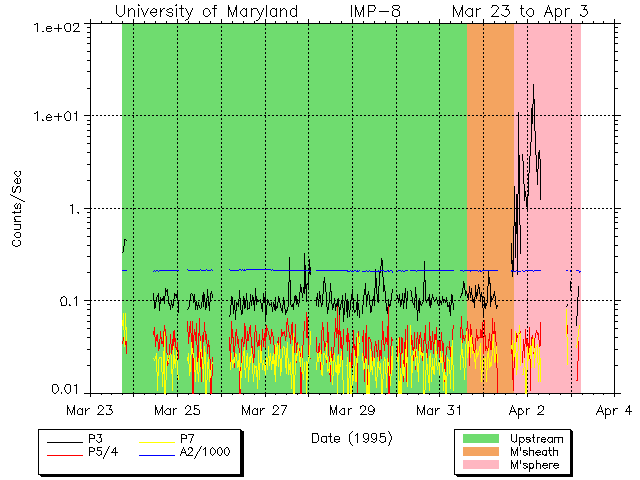
| 1995 March 23 | 1995 April 4 | Plot | List |
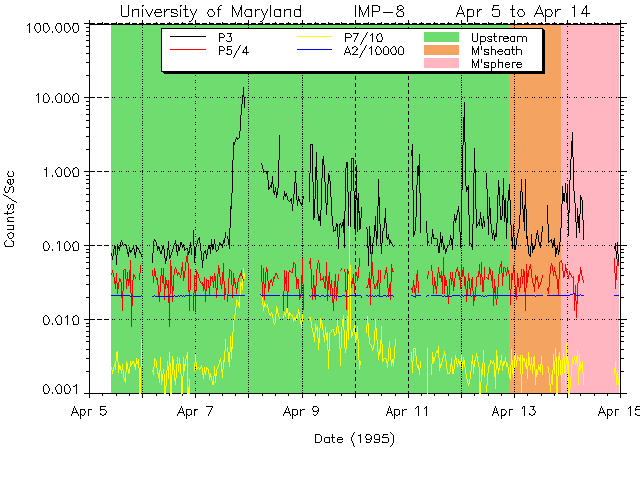
| 1995 April 4 | 1995 April 16 | Plot | List |
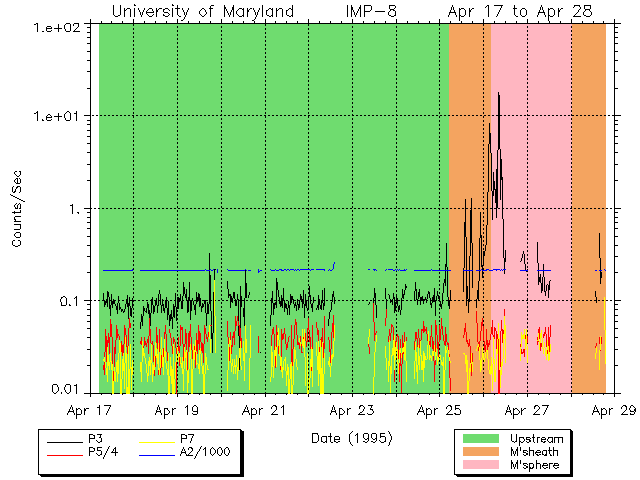
| 1995 April 17 | 1995 April 29 | Plot | List |
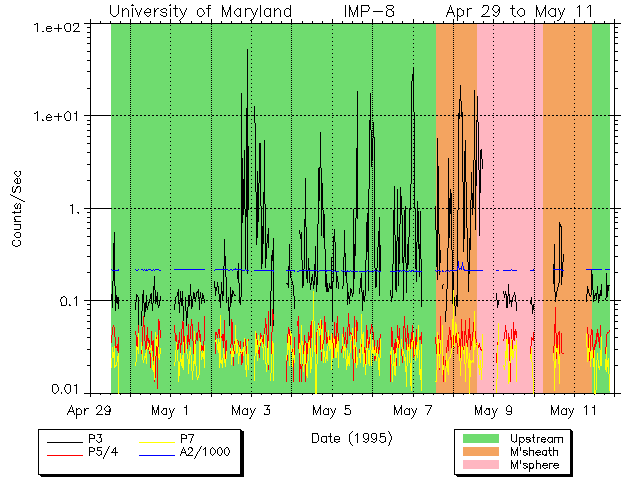
| 1995 April 29 | 1995 May 12 | Plot | List |
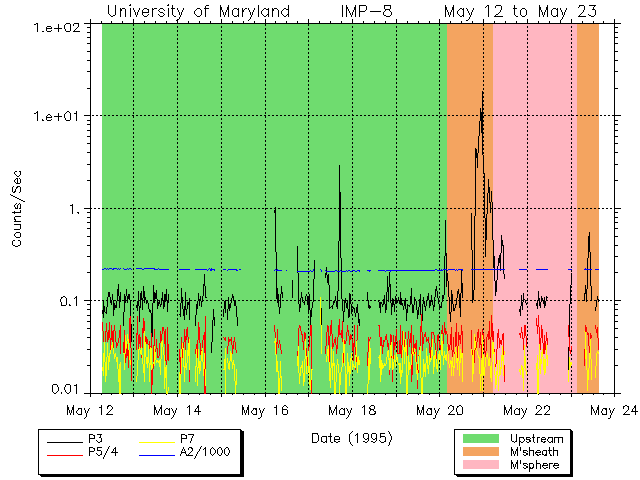
| 1995 May 12 | 1995 May 24 | Plot | List |
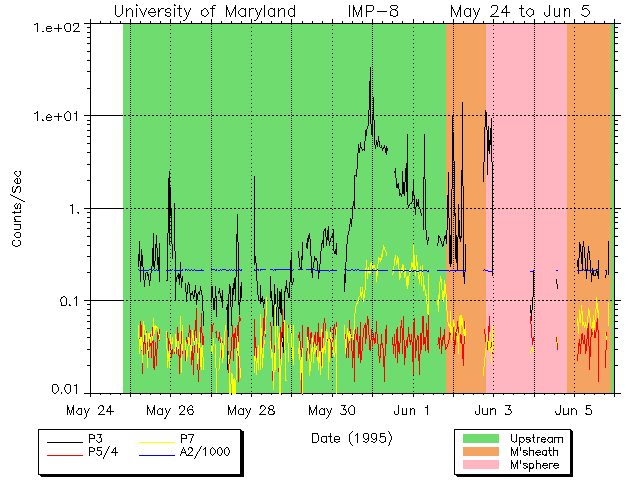
| 1995 May 24 | 1995 June 6 | Plot | List |
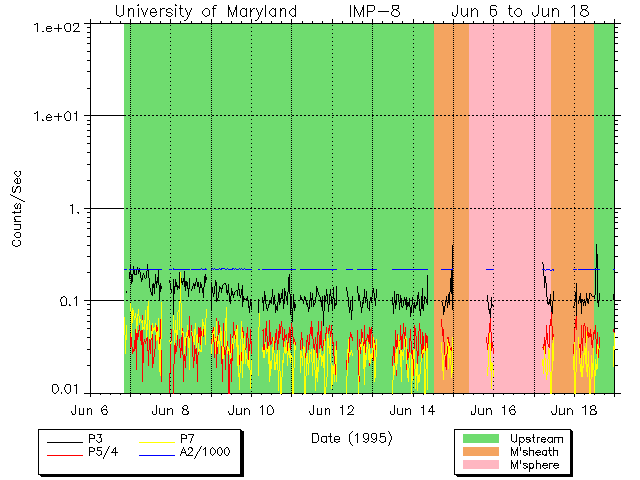
| 1995 June 6 | 1995 June 19 | Plot | List |
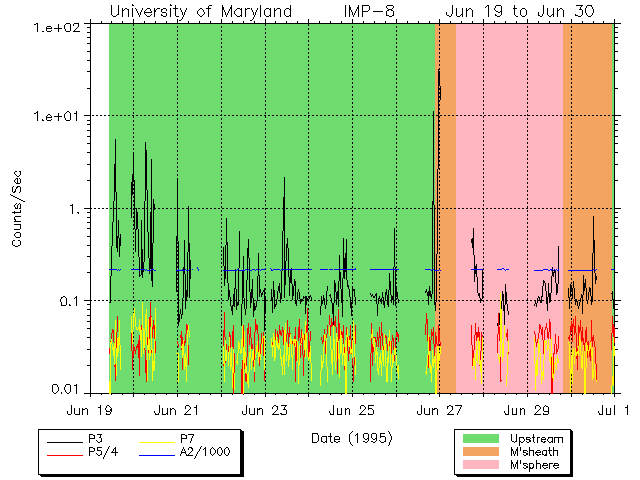
| 1995 June 19 | 1995 July 1 | Plot | List |
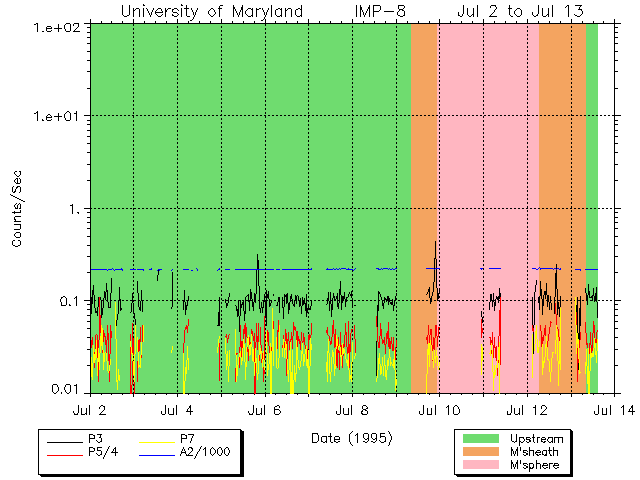
| 1995 July 2 | 1995 July 14 | Plot | List |
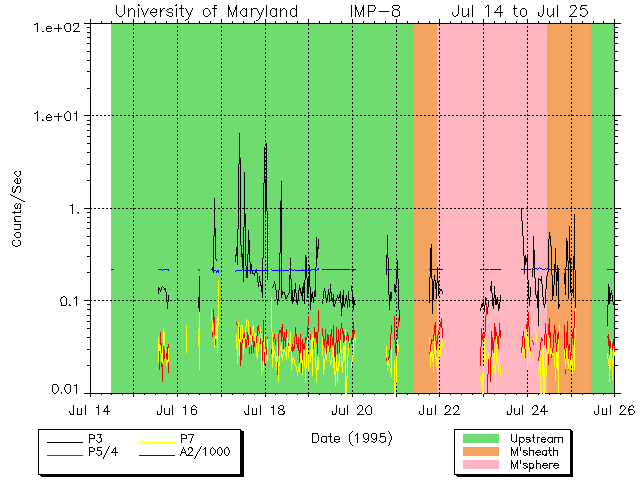
| 1995 July 14 | 1995 July 26 | Plot | List |
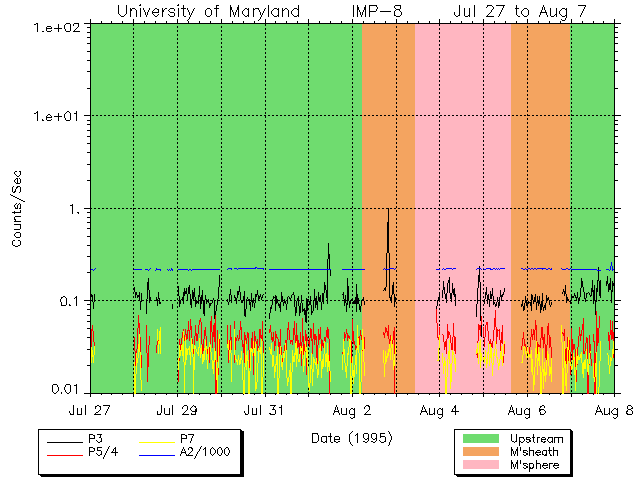
| 1995 July 27 | 1995 August 8 | Plot | List |
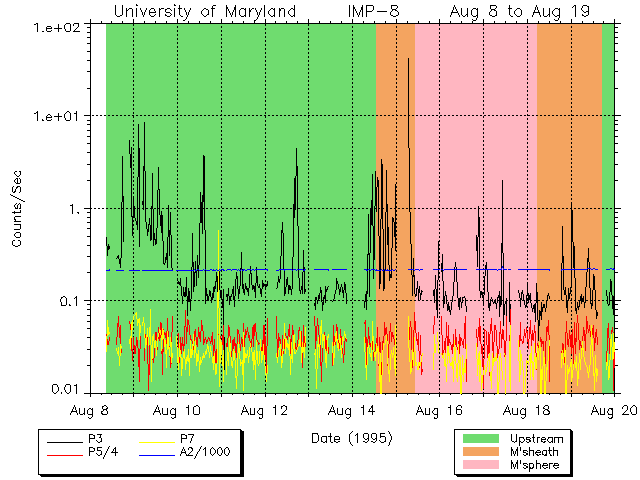
| 1995 August 8 | 1995 August 20 | Plot | List |
Data for previous year | Back to UMd IMP8 home page | Data for following year